Resources
Resources
It's that time of year when basketball has a way of sneaking into your classroom whether you planned for it or not. We put together three Superstructures that meet students where their attention already is, and connect it to real learning. Each one is ready to run in 20 minutes or less. Take a look.
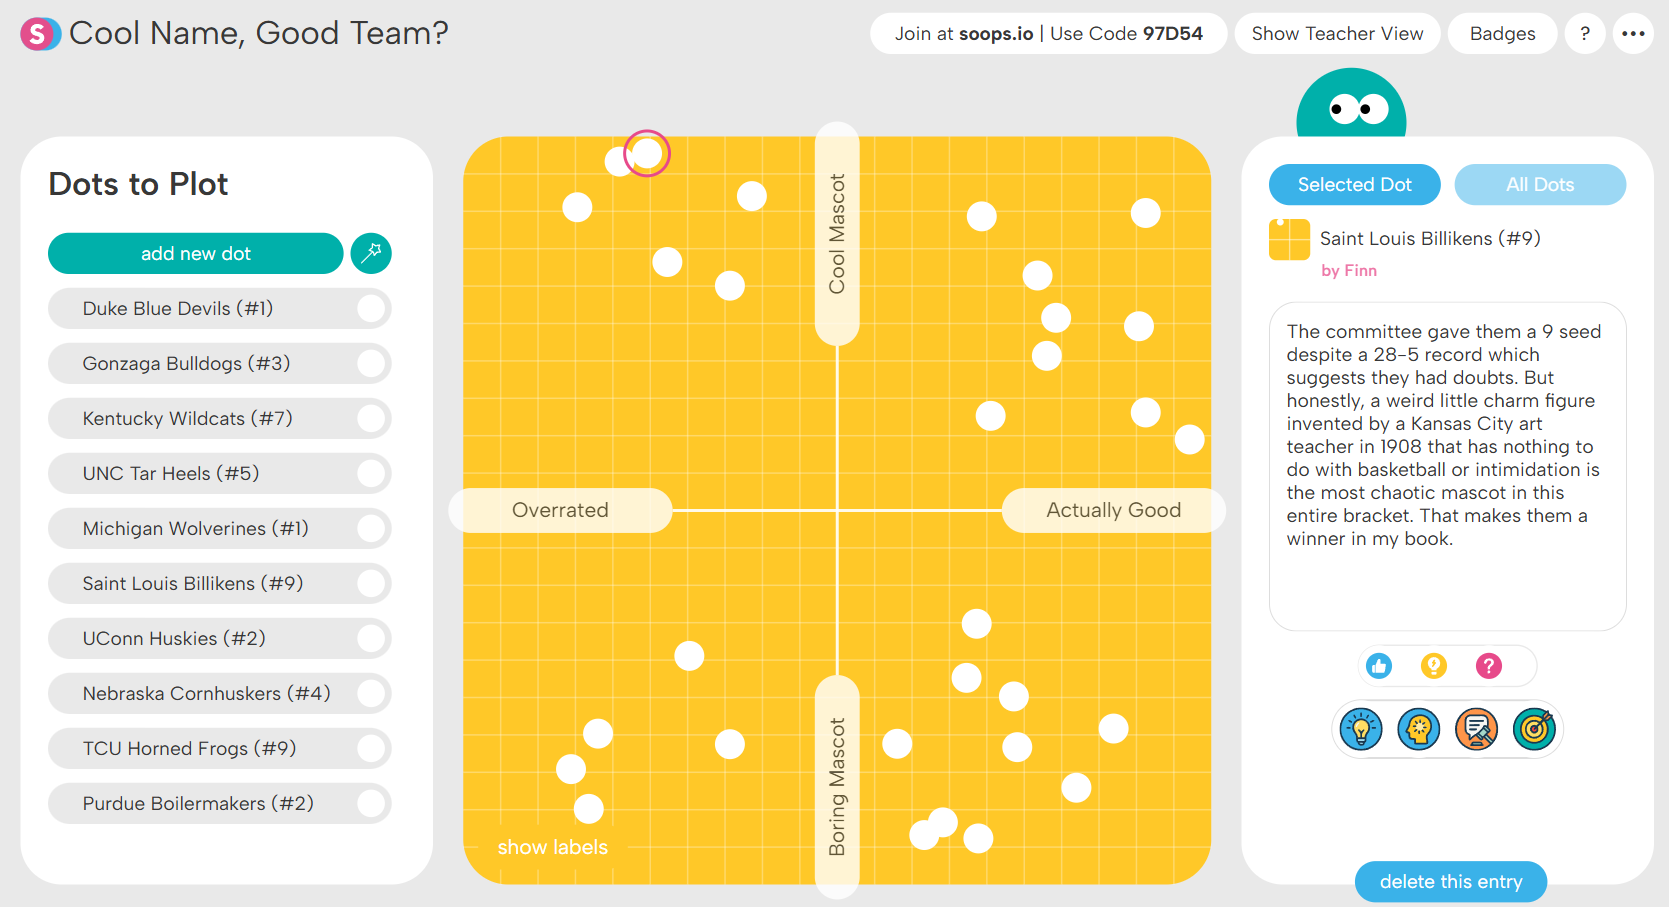
Lots of students have basketball opinions: which teams are overrated, which mascots are cool. This Dot Plot structure lets them place ten tournament teams on two axes—success and mascot coolness—and defend their placements with evidence. It’s a bracket debate that doubles as a writing warm-up.
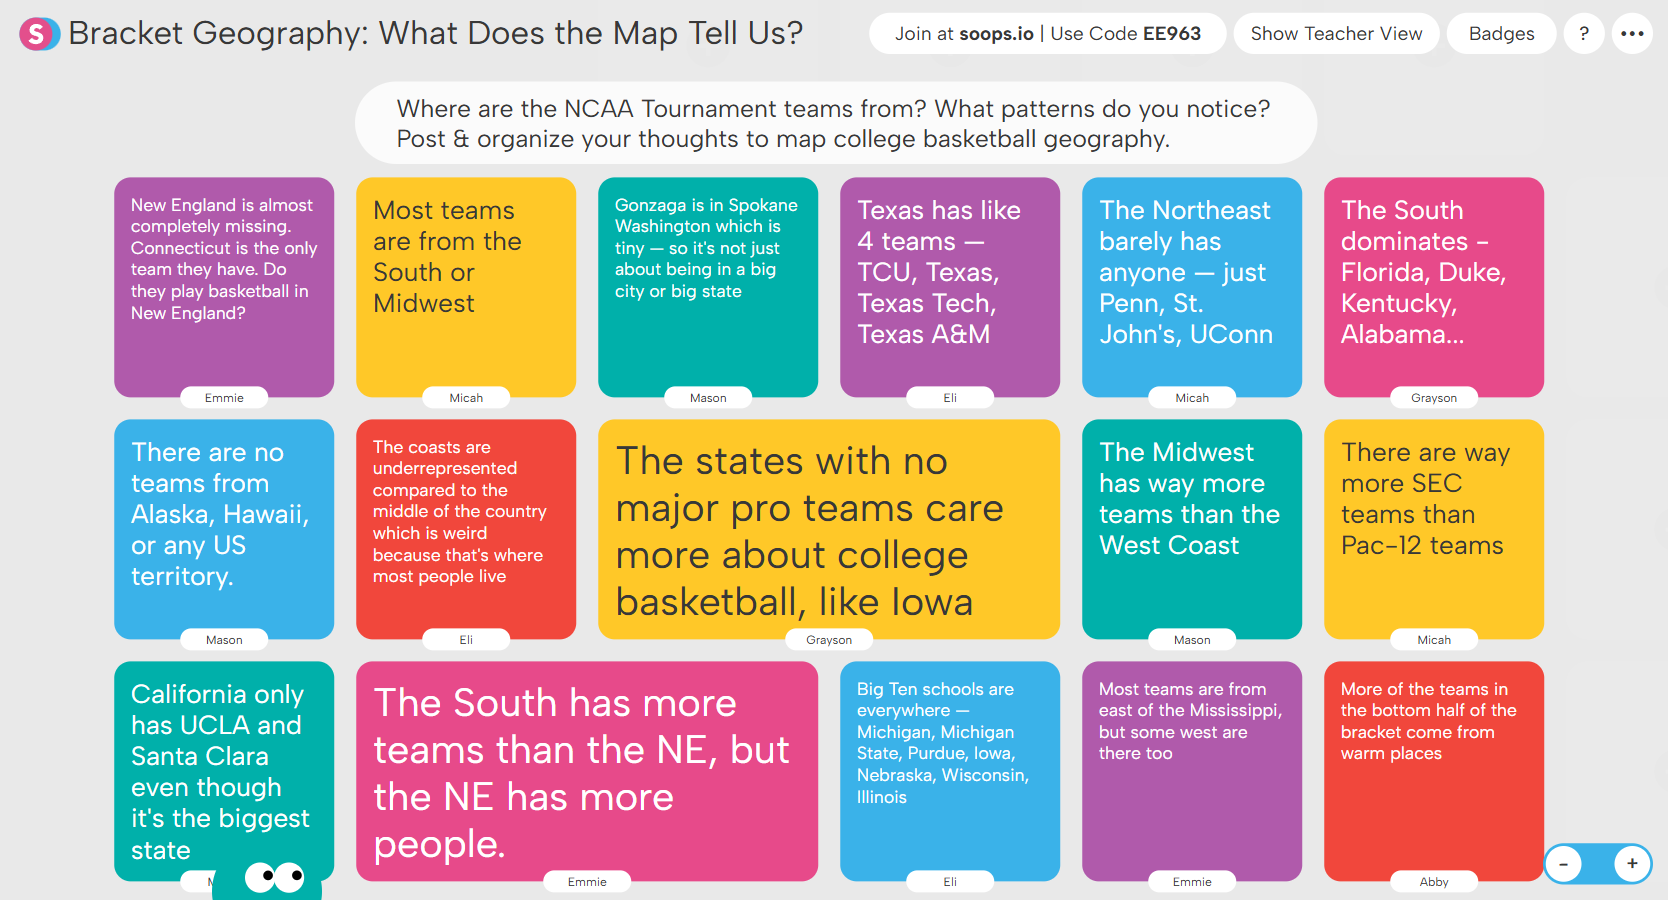
The 68-team bracket is a real dataset about American geography—and it tells a surprising story about which regions produce elite programs and why. In this Noteboard structure, students post and organize geographic observations, practicing the spatial and cultural analysis at the heart of geography standards.
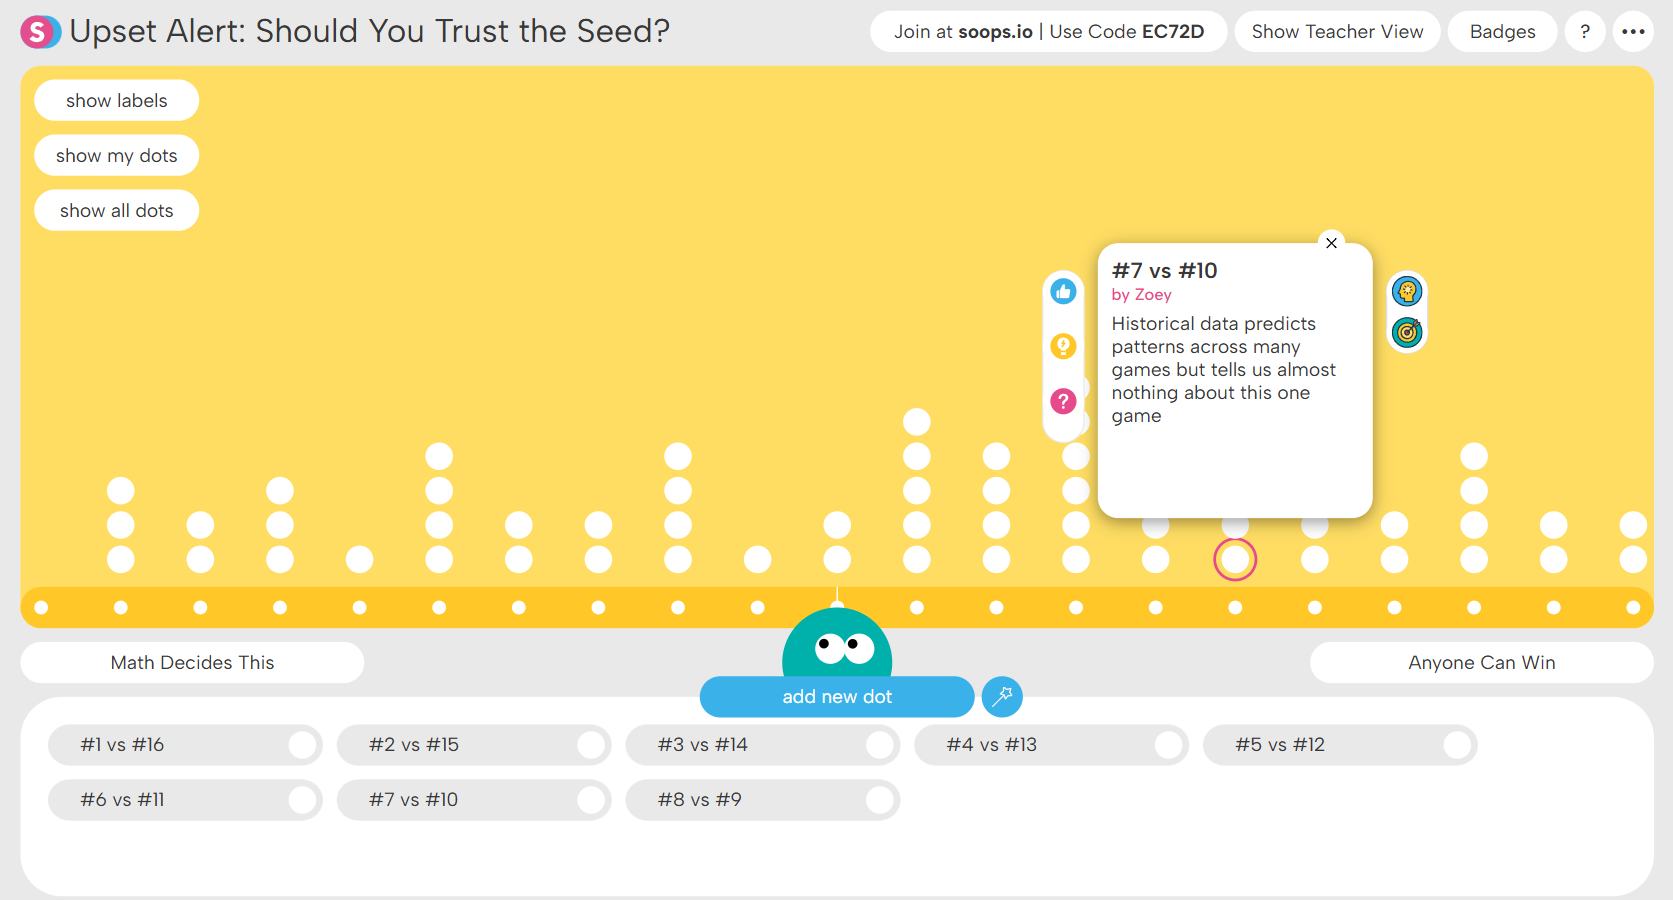
In this Spectrum structure, students place eight classic tournament matchups on a spectrum from "Math Decides This" to "Anyone Can Win"—and defend their reasoning. For classes ready to go deeper, pair it with historical seed upset rates to test whether the math backs up their instincts. It’s statistical reasoning that shows up from middle school probability through high school stats.
Try one with your class this week and channel the energy they already have into something structured and worth discussing.