Superstructures for Math

Superstructures gives the whole class a space to engage in mathematical discourse and explore ideas about numbers, patterns, and relationships. Additionally, Superstructures helps students connect mathematical concepts to real-world contexts and careers where math plays an important role. Students contribute ideas simultaneously—making conjectures, explaining their reasoning, and connecting concepts—while seeing how their classmates think in real time. Structured formats support core mathematical thinking skills such as logical reasoning, justification, and generalization, helping students build strong conceptual foundations. The result is a classroom where reasoning is visible and students engage confidently in collaborative mathematical thinking.

How to Use Superstructures

1

Before the Activity

Create the Superstructure and share its class code with your students. As you introduce the structure topic, also share learning goals, discuss norms, and set expectations for student responses. Tell students to click the "Watch Help Video" button when they enter the structure.

2

During the Activity

Encourage students as they work and ask guiding questions along the way. Refer to the Class Insights panel in the Teacher View for helpful notes and perspective on class activity. Monitor the Student Progress panel to celebrate student successes and identify those who need extra support.

3

After the Activity

Lead your class in a discussion. We recommend discussing patterns, clusters, and outliers in student thinking. Celebrate students who've earned badges. Utilize Class Insights in Teacher View for helpful ideas.

Applying Each Structure in Math

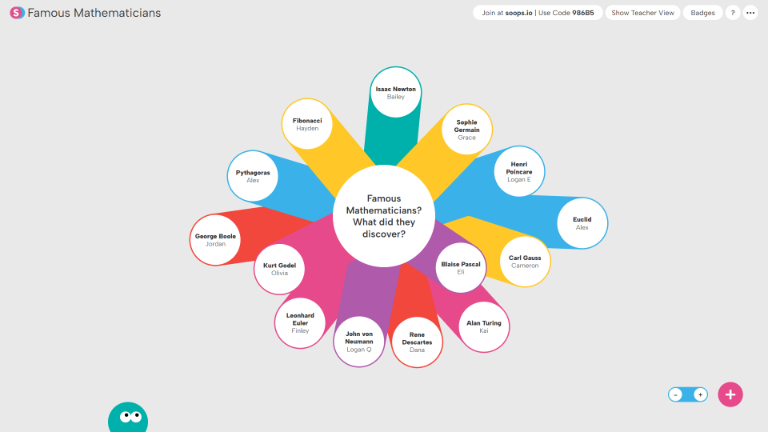
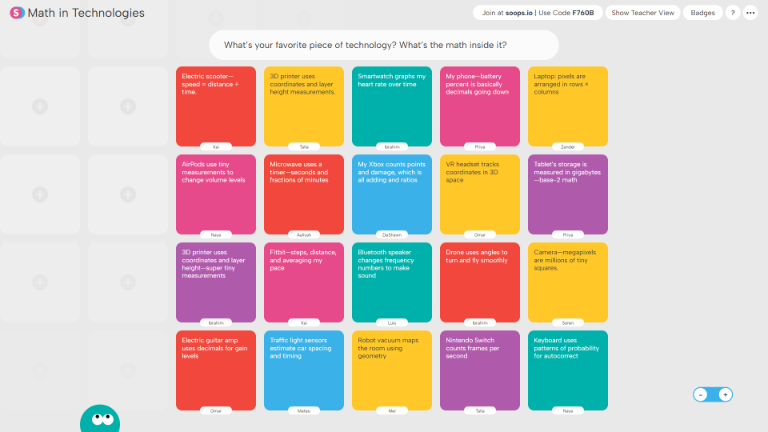
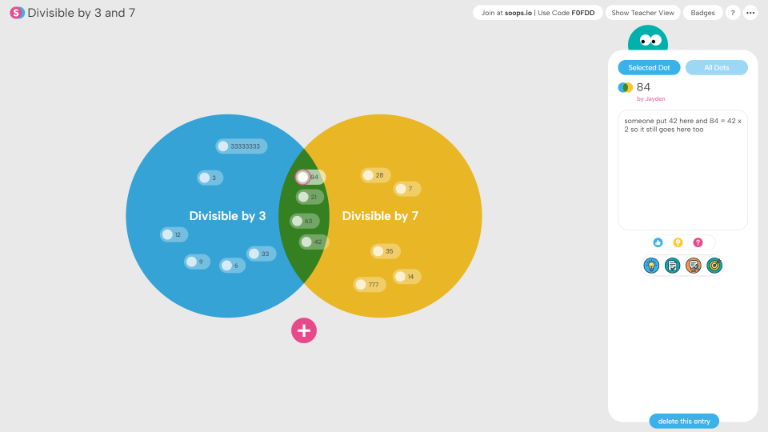
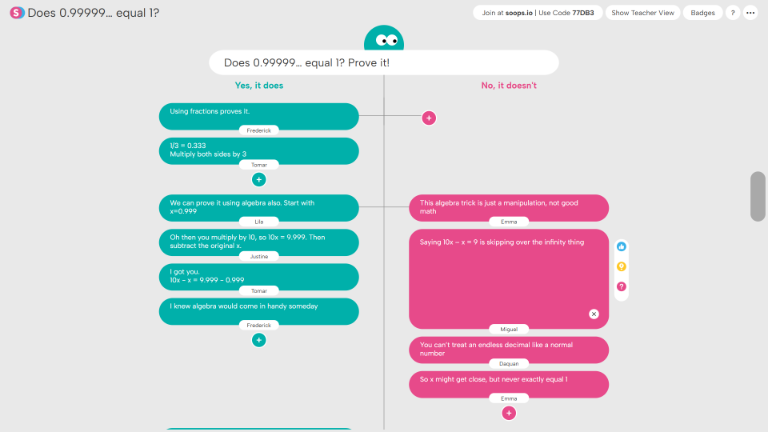
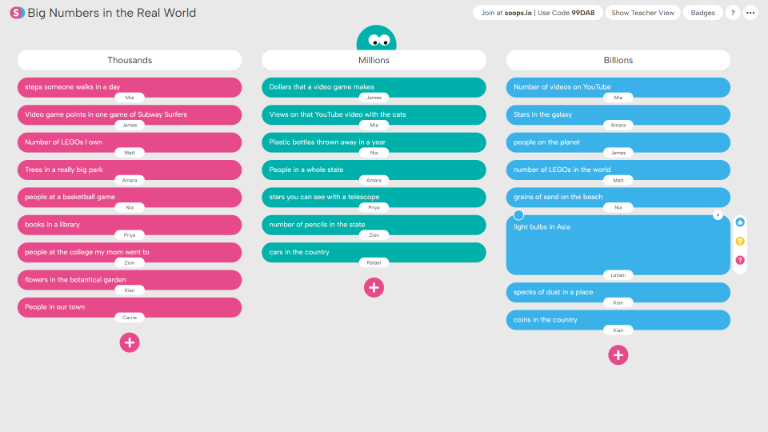
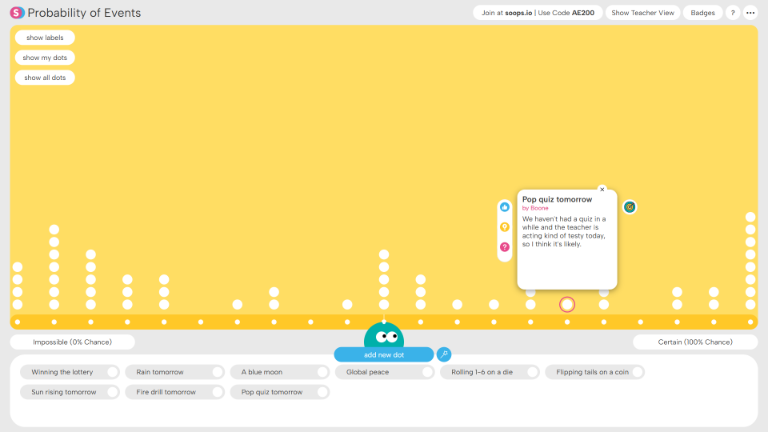
This guide highlights a set of Math examples for each of the ten Superstructures. Each structure title links to its section in the Structures Guide, and each screenshot links to a completed sample. You’ll also find links for ready-to-use structure templates, which you can use as-is or adapt for your own classroom.

Interactive diagram listing famous mathematicians around a central question: 'Famous Mathematicians? What did they discover?' with names including Isaac Newton, Fibonacci, Sophie Germain, Henri Poincare, Euclid, Carl Gauss, Blaise Pascal, Alan Turing, Rene Descartes, John von Neumann, Leonhard Euler, Kurt Godel, George Boole, and Pythagoras.Screenshot of a digital brainstorming board titled 'Math in Technologies' with colorful notes listing students’ favorite technologies and the math concepts inside them.Venn diagram showing numbers divisible by 3 in a blue circle, numbers divisible by 7 in a yellow circle, and numbers divisible by both 3 and 7 in the overlapping green area, including numbers like 21, 42, and 84.Interactive debate board titled 'Does 0.99999... equal 1? Prove it!' with two columns contrasting arguments: left side in teal supports that 0.99999... equals 1 using algebra and fractions; right side in pink opposes, saying infinite decimals can't be treated as normal numbers.Interactive scatter plot of animal speed versus size with dots for various animals, highlighting Blue Whale as massive and fast with descriptive info on the right.A colorful mind map showing number systems and categories with nodes for Real Numbers, Irrational Numbers, Rational Numbers, Complex Numbers, Imaginary Numbers, Integers, Non-Integers, and related subcategories connected by lines.Poll results showing opinions on the most convincing proof of the Pythagorean Theorem, divided into three categories: Algebraic Proof, Geometric Rearrangement Proof, and Similar Triangles Proof, with multiple user comments in colorful speech bubbles under each category.Interactive table showing different methods to solve linear equations with columns labeled by student names and rows for equation steps including initial equation, addition/subtraction property, multiplication/division property, and solution check.Interactive chart titled 'Big Numbers in the Real World' with three columns: Thousands, Millions, and Billions showing examples like steps in a day, video game earnings, and number of videos on YouTube.Interactive probability scale with white dots representing the likelihood of events from impossible (0%) to certain (100%), featuring labels such as winning the lottery, rain tomorrow, and popping quiz tomorrow highlighted with a tooltip.
Create a Superstructure Today!